如何实现python绘制混淆矩阵?
2020-11-04 11:10:389817浏览 · 0收藏 · 0评论
大家从python基础到如今的入门,想必都对python有一定基础,今天小编给大家带来一个关于python的高阶内容——绘制混淆矩阵,一起来看下吧~
介绍:
混淆矩阵通过表示正确/不正确标签的计数来表示模型在表格格式中的准确性。
计算/绘制混淆矩阵:
以下是计算混淆矩阵的过程。
您需要一个包含预期结果值的测试数据集或验证数据集。
对测试数据集中的每一行进行预测。
从预期的结果和预测计数:
每个类的正确预测数量。
每个类的错误预测数量,由预测的类组织。
然后将这些数字组织成表格或矩阵,如下所示:
Expected down the side:矩阵的每一行都对应一个预测的类。
Predicted across the top:矩阵的每一列对应于一个实际的类。
然后将正确和不正确分类的计数填入表格中。
Reading混淆矩阵:
一个类的正确预测的总数进入该类值的预期行,以及该类值的预测列。
以同样的方式,一个类别的不正确预测总数进入该类别值的预期行,以及该类别值的预测列。
对角元素表示预测标签等于真实标签的点的数量,而非对角线元素是分类器错误标记的元素。混淆矩阵的对角线值越高越好,表明许多正确的预测。
用Python绘制混淆矩阵 :
import itertools

import numpy as np

import matplotlib.pyplot as plt

from sklearn import svm, datasets

from sklearn.model_selection import train_test_split

from sklearn.metrics import confusion_matrix

# import some data to play with

iris = datasets.load_iris()

X = iris.data

y = iris.target

class_names = iris.target_names

# Split the data into a training set and a test set

X_train, X_test, y_train, y_test = train_test_split(X, y, random_state=0)

# Run classifier, using a model that is too regularized (C too low) to see

# the impact on the results

classifier = svm.SVC(kernel='linear', C=0.01)

y_pred = classifier.fit(X_train, y_train).predict(X_test)

def plot_confusion_matrix(cm, classes,

normalize=False,

title='Confusion matrix',

cmap=plt.cm.Blues):

"""

This function prints and plots the confusion matrix.

Normalization can be applied by setting `normalize=True`.

"""

if normalize:

cm = cm.astype('float') / cm.sum(axis=1)[:, np.newaxis]

print("Normalized confusion matrix")

else:

print('Confusion matrix, without normalization')

print(cm)

plt.imshow(cm, interpolation='nearest', cmap=cmap)

plt.title(title)

plt.colorbar()

tick_marks = np.arange(len(classes))

plt.xticks(tick_marks, classes, rotation=45)

plt.yticks(tick_marks, classes)

fmt = '.2f' if normalize else 'd'

thresh = cm.max() / 2.

for i, j in itertools.product(range(cm.shape[0]), range(cm.shape[1])):

plt.text(j, i, format(cm[i, j], fmt),

horizontalalignment="center",

color="white" if cm[i, j] > thresh else "black")

color="white" if cm[i, j] > thresh else "black")

plt.tight_layout()

plt.ylabel('True label')

plt.xlabel('Predicted label')

# Compute confusion matrix

cnf_matrix = confusion_matrix(y_test, y_pred)

np.set_printoptions(precision=2)

# Plot non-normalized confusion matrix

plt.figure()

plot_confusion_matrix(cnf_matrix, classes=class_names,

title='Confusion matrix, without normalization')

# Plot normalized confusion matrix

plt.figure()

plot_confusion_matrix(cnf_matrix, classes=class_names, normalize=True,

title='Normalized confusion matrix')

plt.show()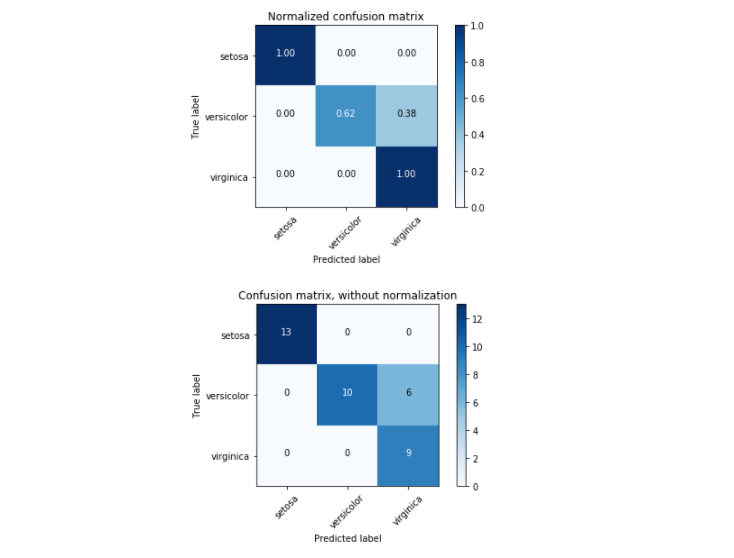
Confusion matrix, without normalization

[[13 0 0]

[ 0 10 6]

[ 0 0 9]]

Normalized confusion matrix

[[ 1. 0. 0. ]

[ 0. 0.62 0.38]

[ 0. 0. 1. ]]
好了,大家可以消化学习下哦~如需了解更多python实用知识,点击进入PyThon学习网教学中心。

关注公众号,随时随地在线学习
python学习网
认证0级讲师

 分享到微博
分享到微博 微信扫一扫
微信扫一扫
 流芳
流芳