python如何绘柱状图
silencement
2020-02-03 22:22:494282浏览 · 0收藏 · 0评论

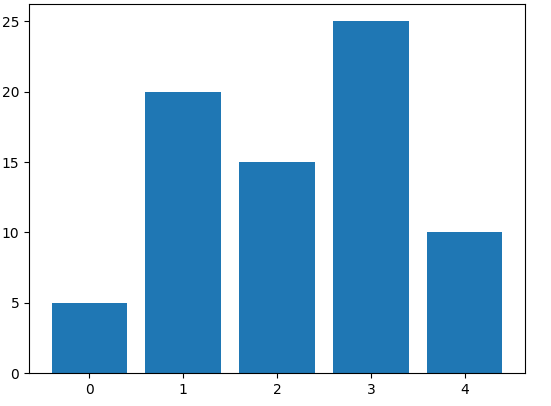
使用Python中的matplotlib画基本的柱状图
import matplotlib.pyplot as plt

data = [5, 20, 15, 25, 10]

plt.bar(range(len(data)), data)
plt.show()
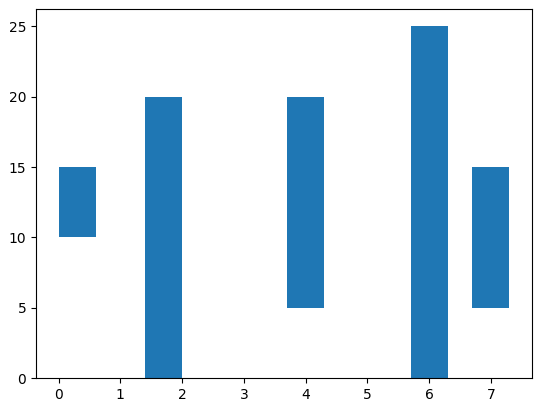
plt.bar 函数签名为:
bar(left, height, width=0.8, bottom=None, **kwargs)
事实上,left,height,width,bottom这四个参数确定了柱体的位置和大小。默认情况下,left为柱体的居中位置(可以通过align参数来改变left值的含义),即:
(left - width / 2, bottom)为左下角位置
(left + width / 2, bottom + height)为右上角位置
例如
import matplotlib.pyplot as plt

data = [5, 20, 15, 25, 10]

plt.bar([0.3, 1.7, 4, 6, 7], data, width=0.6, bottom=[10, 0, 5, 0, 5])
plt.show()
推荐学习《Python教程》!

关注公众号,随时随地在线学习

 分享到微博
分享到微博 微信扫一扫
微信扫一扫
 流芳
流芳


 20818
20818